Wie die Wahl der Trainingsdaten die Praxistauglichkeit von Modellen beeinflusst
von DI Dr. Alexander Maletzky
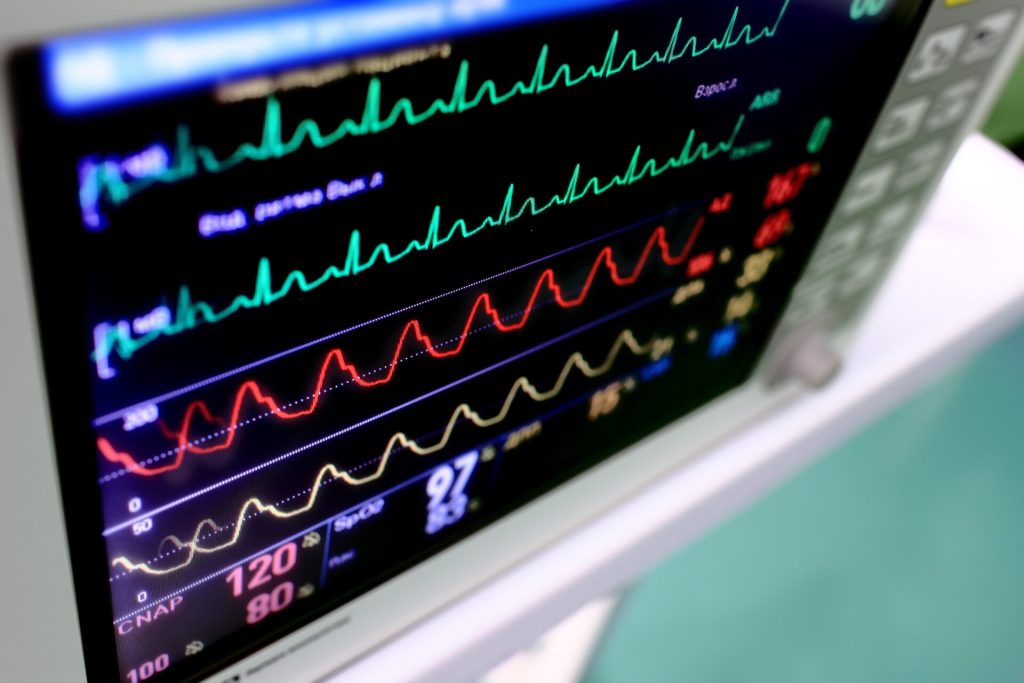
Zeitreihendaten, beispielsweise Maschinendaten in der Industrie oder Vitalparameter in der Medizin, sind heutzutage eine wichtige Datenquelle zur Analyse komplexer Systeme. Moderne Analysesysteme fußen meist auf Methoden des maschinellen Lernens, also auf gelernten Vorhersagemodellen, und greifen auf diese Datenquellen zurück. Für die Entwicklung praxistauglicher Modelle ist die richtige Wahl der Trainingsdaten jedoch eine herausfordernde Aufgabe.
Inhalt
Das Problem: Die richtige Länge der Sequenzen
Ein konkretes Beispiel aus der Intensivmedizin
Fazit
Autor
Weiterführende Informationen
Referenzen
Das Problem: Die richtige Länge der Sequenzen
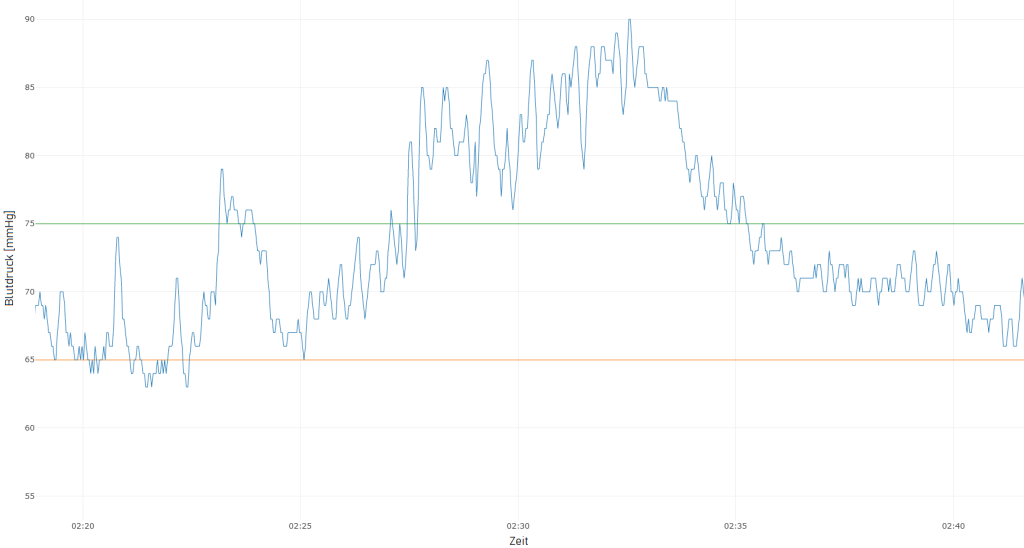
Zeitreihendaten werden üblicherweise in regelmäßigen Abständen automatisiert von Sensoren aufgezeichnet, und können wie in Abbildung 1 als Liniendiagramm visualisiert werden. Wie im Fachbeitrag Explorative Datenanalyse mit Zeitreihen erläutert, ist die visuelle Inspektion von Zeitreihendaten ein wichtiger Schritt im Datenanalyse-Workflow, der einige Schwierigkeiten mit sich bringt. Noch herausfordernder ist allerdings die automatische Zeitreihenanalyse, bei der ein KI-Modell eigenständig Zeitreihen klassifiziert, Anomalien entdeckt, oder den zukünftigen Verlauf einer Zeitreihe vorhersagt. Modelle dieser Art basieren heutzutage meist auf Methoden des maschinellen Lernens, d.h. sie „lernen“ selbstständig anhand von Trainingsdaten die richtigen Entscheidungen zu treffen. Eine der Hauptaufgaben der Entwickler der Modelle ist dabei – neben der Wahl der geeigneten Modellklasse und -parameter – vor allem die Wahl der Trainingsdaten. Zeitreihen liegen nämlich üblicherweise als lange Sequenzen von Messwerten vor, die sich über längere Zeiträume erstrecken. Je nach Anwendungsgebiet sollen Modelle aber bereits anhand vergleichsweise kurzer Ausschnitte valide Entscheidungen treffen können, und müssen somit auch auf solchen Ausschnitten trainiert werden – und wie diese ausgewählt werden, hat einen starken Einfluss auf die Praxistauglichkeit der resultierenden Modelle. Die Wahl muss nämlich einerseits so erfolgen, dass keine sogenannte Stichprobenverzerrung entsteht, d.h. die Samples die verschiedenen Aspekte der Zeitreihe (Kurvenmorphologie, Periodizität, Trends, etc.) adäquat widerspiegeln. Andererseits sollen die trainierten Modelle aber gerade auf jenen Ereignissen, die für den Anwender besonders interessant sind, korrekt funktionieren. Wenn diese nur selten vorkommen, müssen sie bei der Modellerstellung entsprechend überproportional berücksichtigt werden, was wiederum zu einer Stichprobenverzerrung führen kann.
Abbildung 1: Mittlerer arterieller Blutdruck (MAP) eines Intensivpatienten für 30 Minuten, mit einem Messwert pro Sekunde. Die grüne Linie gibt den Wert an, über dem der Blutdruck als normal gilt, und die orange Linie jenen Wert, der einen kritischen Blutdruckabfall darstellt.
Ein konkretes Beispiel aus der Intensivmedizin
In der Intensivmedizin wird der Zustand von Patienten kontinuierlich überwacht, um im Bedarfsfall ein schnelles Einschreiten des Pflegepersonals zu ermöglichen. Besonderes Augenmerk wird hierbei auf akute hypotensive Episoden (AHEs) gelegt, d.h., kritische Blutdruckabfälle, die zu irreparablen Schäden führen können. Die Vorhersage von zukünftigen AHEs in Form eines Frühwarnsystems, um bereits vor deren Eintritt Gegenmaßnahmen setzen zu können, ist ein aktuell viel beachtetes Forschungsthema im Bereich der künstlichen Intelligenz [1, 2]. Auch Forscher*innen der Abteilung Medizin-Informatik der RISC Software GmbH beschäftigen sich aktuell im Projekt MC³ gemeinsam mit den Forschungspartnern vom MedCampus III des Kepler Universitätsklinikums und dem Institut für Machine Learning der JKU Linz mit dieser Fragestellung.
Modellentwicklung: Sample-Auswahl für eine hohe Klassifikationsgenauigkeit
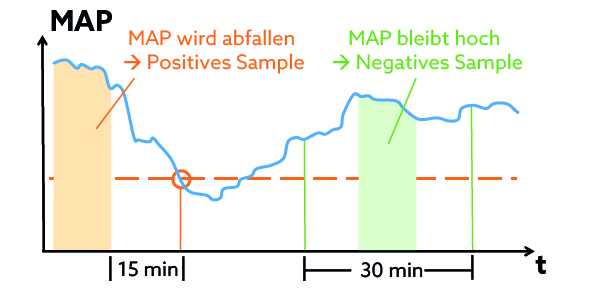
Eine mögliche Strategie zur Auswahl der Trainingssamples orientiert sich an der Zeitreihe des mittleren arteriellen Blutdrucks (MAP; siehe Abbildung 1): Immer kurz bevor der MAP unter den kritischen Wert von 65mmHg fällt, wird ein positiv gelabeltes Sample ausgewählt, also ein kurzes Beobachtungsfenster, anhand dessen das Modell später den bevorstehenden Abfall vorhersagen und Alarm auslösen können soll. Bleibt der MAP stattdessen für einen längeren Zeitraum konstant über 75mmHg, wird darin ein negativ gelabeltes Sample ausgewählt, d.h. hier soll das Modell keinen Alarm auslösen. In Abbildung 2 wird die Auswahl der Samples schematisch dargestellt. Als Eingangsdaten für das Modell dienen in beiden Fällen verschiedenste Zeitreihendaten des Patienten im Beobachtungsfenster, z.B. MAP, Herzfrequenz, Sauerstoffsättigung, u.v.m.
Abbildung 2: Schematische Darstellung der Sample-Auswahl in Abhängigkeit des mittleren arteriellen Blutdrucks (MAP).
Klassifikationsmodelle, die auf diesen Trainingssamples trainiert werden, erreichen eine hohe Klassifikationsgenauigkeit auf dem unabhängigen Test-Set (das nach dem gleichen Schema generiert wird wie das Trainings-Set). Einem Einsatz in der Praxis steht somit nichts mehr im Weg …
Einsatz in der Praxis: Wo liegt der Fehler?
Natürlich wurde das entwickelte Modell nicht sofort im Krankenhaus eingesetzt, sondern der Praxiseinsatz zunächst in einer Testumgebung simuliert. Dabei hat sich gezeigt, dass das Modell fast ununterbrochen Alarm auslöst, selbst wenn weit und breit keine AHE in Sicht ist. Obwohl die Klassifikationsgenauigkeit auf dem Test-Set sehr gut ist, funktioniert das Modell in der Praxis nicht.
Fehleranalyse: Auswahl der Trainingssamples
Woran liegt die Praxisuntauglichkeit des Modells? Wie sich gezeigt hat, enthalten die Trainingssamples nur „Extrembeispiele“, die sich zwar leicht klassifizieren lassen, aber nur einen kleinen Teil des Spektrums der in der Realität auftretenden Möglichkeiten abdecken. Der MAP ändert sich nämlich meistens nur langsam, d.h., ist am Ende des Beobachtungsfensters von positiv gelabelten Samples üblicherweise deutlich niedriger als bei negativ gelabelten Samples. Das Modell ignoriert sämtliche Zeitinformation und alle anderen Zeitreihen und achtet ausschließlich auf den letzten verfügbaren MAP-Wert: Ist dieser eher hoch, wird kein Alarm ausgelöst, andernfalls schon. Das funktioniert in der Praxis nicht, da sich der MAP dann vielfach in einer „Grauzone“ bewegt, die in den Trainingssamples nicht vorkommt.
Wie kann man es besser machen?
Eine Stichprobenverzerrung lässt sich dadurch vermeiden, dass die Trainingssamples entweder zufällig oder regelmäßig (z.B. alle 10 Minuten) ausgewählt werden, ungeachtet des MAP. So ein Ansatz bringt jedoch andere Probleme mit sich: Einerseits ist die Einteilung eines Samples in „positiv“ (MAP wird unter kritischen Wert fallen) und „negativ“ (MAP bleibt normal) nicht mehr so einfach, denn was tun, wenn der MAP zwar über 65mmHg bleibt, aber nur knapp? Es macht daher mehr Sinn, kein Klassifikations-, sondern ein Regressionsmodell zu trainieren, das beispielsweise den genauen MAP-Wert 15 Minuten später vorhersagen soll. Ein anderes Problem ist das im Rahmen der Fehleranalyse entdeckte Phänomen, dass der MAP meistens nur langsam abfällt. Aus medizinischer Sicht sind nämlich genau jene (seltenen) Fälle interessant, wo der MAP rapide abfällt, weil ein Frühwarnsystem nur in solchen Fällen Sinn macht. Um das Modell für solche Situationen zu „sensibilisieren“ kann ihnen beim Training eine höhere Wichtigkeit beigemessen werden.
Forscher*innen des Projekts MC3 sind gerade dabei, Vorhersagemodelle für akute hypotensive Episoden basierend auf dem neuen Ansatz zu trainieren. Erweisen sie sich als praxistauglich, könnten sie schon in naher Zukunft das Pflegepersonal auf Intensivstationen unterstützen.
Fazit
Wie immer im maschinellen Lernen ist ein umfassendes Verständnis der Daten und des Anwendungsfalls für die Entwicklung gut funktionierender, praxistauglicher Modelle unumgänglich – nicht nur im medizinischen Umfeld. Oftmals sind sowohl Domänenwissen als auch explorative Datenanalysen (siehe Explorative Datenanalyse mit Zeitreihen) notwendig, um die nötigen Informationen zu extrahieren, mögliche Probleme frühzeitig zu erkennen, und die Modellentwicklung entsprechend anzupassen. Wie erläutert, schließt das insbesondere auch Trainingssamples mit ein, deren richtige Wahl gerade im Fall von Zeitreihendaten eine zentrale Rolle spielt.
Weiterführende Informationen
Technologiestack: Python 3, mit den einschlägigen Datenanalyse-Packages (Pandas, scikit-learn, etc.).
MC³: Medical Cognitive Computing Center, gemeinsames Forschungsprojekt von Kepler Universitätsklinikum Linz / MedCampus III, Johannes Kepler Universität Linz / Institut für Machine Learning, und RISC Software GmbH / Abteilung Medizininformatik.
Kontakt
Autor
DI Dr. Alexander Maletzky
Researcher & Developer
Referenzen
F Hatib et al. Machine-learning Algorithm to Predict Hypotension Based on High-fidelity Arterial Pressure Waveform Analysis. Anesthesiology 129(4): 663-674, 2018. DOI: 10.1097/ALN.0000000000002300
S Hyland et al. Early prediction of circulatory failure in the intensive care unit using machine learning. Nature Medicine 26(3): 364-373, 2020. DOI: 10.1038/s41591-020-0789-4