Making better decisions thanks to Prescriptive Analytics
Step by step from descriptive to prescriptive analytics
by DI Dr. Michael Bögl
Digitization and topics such as Industry 4.0 and the Internet of Things have led to many companies collecting their data on a large scale in a structured manner. This collected data is then utilized in different ways. If correlations are present in this data and a prognosis model can be derived, then this model can also be taken into account in planning and control. This guarantees significant added value, such as a reduction in costs and time, a more efficient use of resources, etc. How something like this looks concretely, what is assumed and which possibilities arise, are shown in this article.
Table of contents
- From data collection to prescriptive analytics
- Prescriptive analytics in decision support
- Which methods are available?
- Questions and use cases
- The path to prescriptive analytics
- Author
From data collection to prescriptive analytics
Digitization in recent years has created the basis for companies to continuously collect and store data on their processes and operations in a structured manner. To create added value, companies must make the best possible use of this data. Forecasting models are created from the collected data in order to be able to estimate future developments, events or conditions. These can be, for example, models for sales forecasts, wear and tear of tools in production, customer requirements, stock levels, traffic-dependent travel times, etc.
By combining the forecast models with optimization models (for calculating optimal decisions), different scenarios can automatically be calculated and compared. This provides those responsible with a solid basis for making optimal decisions. The transparent basis for decision-making guarantees that the decisions made are always comprehensible and can be argued.
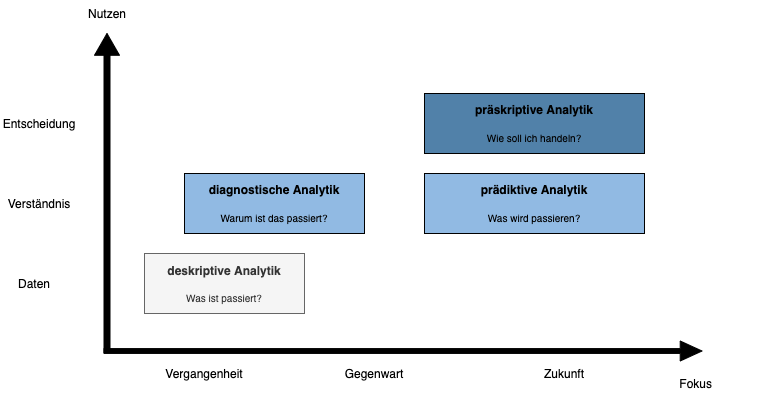
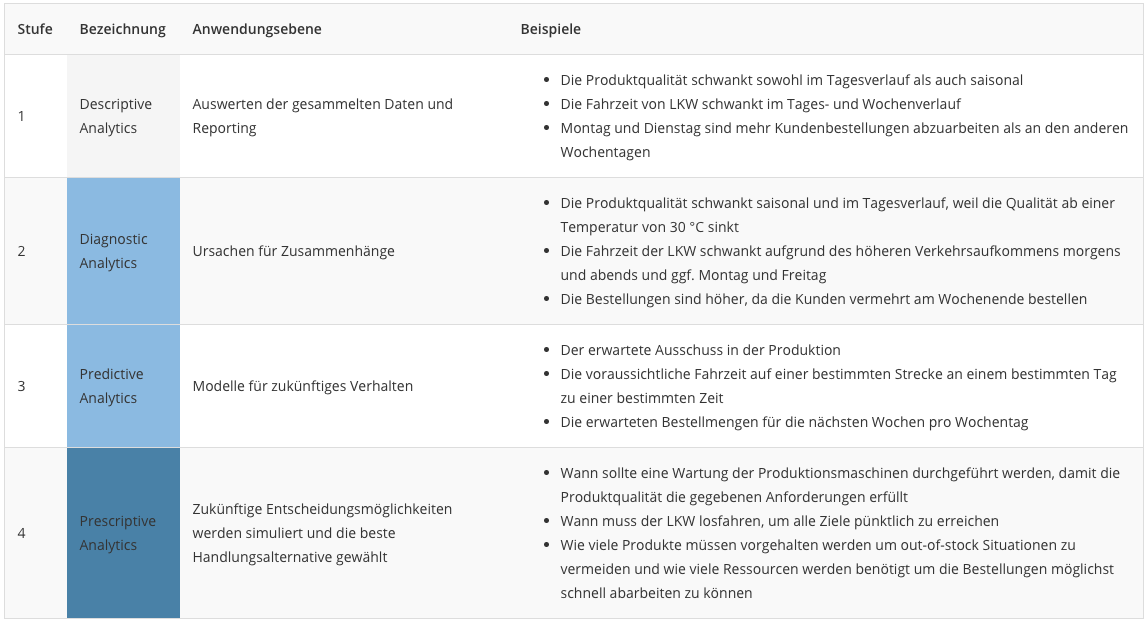
Depending on how the data is used, we speak of different areas of application, or phases or stages, with the benefits increasing the higher the stage (see also Figure 1 and Table 1):
- If the collected data is used to evaluate what has happened, this is referred to descriptive analytics. Relationships in the data are not yet recognized. One result could be that one recognizes that the product quality fluctuates both in the course of the day and seasonally.
- Diagnostic analytics identifies the causes of interrelationships. The prerequisite for implementing targeted improvement measures is to know the causes. For the example from point 1, this means: Product quality fluctuates seasonally and over the course of the day because quality drops from a temperature of 30 °C; or after the first orders following a tool change, the machines have to be recalibrated (this may extend the non-productive time, but leads to higher quality).
- Once all the relevant interrelationships and influencing variables have been determined, models can be created that depict these interrelationships. These models can be used to make statements about future behavior. This is referred to predictive analytics. For example, future sales, rejects in production or the quality of the product can be predicted.
- In prescriptive analytics, future events will be forecasted at first, various decision options will be simulated and evaluated if necessary and the best alternative course of action is subsequently calculated. For this calculation, companies can draw on existing know-how and planning algorithms. If necessary, the planning algorithms can also be extended or additional methods integrated.
The application areas described are shown in Figure 13 according to their focus and utility. While descriptive and diagnostic analytics are directed toward the past and can create a deeper and useful understanding of current data and relationships between them, predictive and prescriptive analytics are oriented toward the future. The identified relationships from the recorded data are used to create benefits for the future.
Prescriptive analytics in decision support
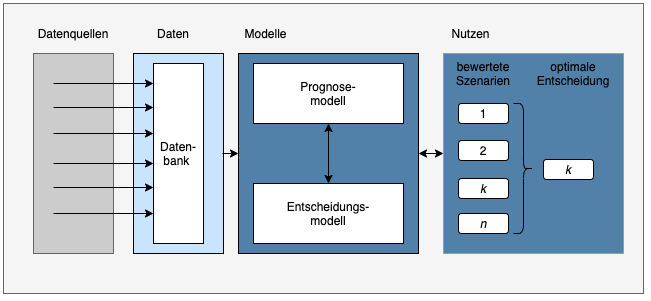
Figure 2 shows the main components of a prescriptive system. The basis is formed by the collected data from different data sources. The necessary models (forecast model and decision model) are created from the data and the available expert knowledge. Based on these models, different scenarios can be evaluated and the decision makers can make the best decision.
A decision support system is shown, i.e., the system evaluates different scenarios, but ultimately the decision is made by the person in charge. If the decision is made by the system, then we speak of decision automation.
Which methods are available?
Methods from different disciplines are available for the implementation of prescriptive models. The concept of prescriptive analytics does not prescribe any particular methods. Predominantly, methods from artificial intelligence are used. The focus is on machine learning and data mining, statistical analysis methods, mathematical programming and simulation. The selection of suitable methods depends very much on the available data, the framework conditions and, above all, the objectives (white-box vs. black-box models, integration of expert knowledge, etc.). The available method portfolio is that extensive that suitable methods can be used for many use cases.
Questions and use cases
In addition to the examples given above, there are many different applications for prescriptive analytics, just like the following ones:
Determination of the residual capacity
How many orders can still be
produced and when will these orders
be completed?
Integrated production and route planning
When should which orders be produced so that customers can be supplied with optimal transport?
Composition of the recipe
What should the formulation (proportions, environmental conditions) look like so that the product meets certain criteria?
Digital twin for the development of production machines
How exactly should the production machine be designed so that operation is as efficient as possible?
Price determination
How high should the price of a product be so that it appeals to a broad group of buyers and the contribution margin remains high?
Healthcare management
What is the (optimal) placement, diameter, duration, and intensity of the beam during radiation therapy to minimize damage to surrounding tissue?
The path to prescriptive analytics
For companies that already have a large database, prescriptive analytics offers the opportunity to generate additional value from the data already available by incorporating the insights gained from the data into planning. Companies that do not have end-to-end data collection or are not using their data for such tasks by now have the opportunity to incrementally increase the value they derive from their data. The stages from descriptive to prescriptive analytics build on each other aand valuable insights can already be gained (together with the business experts) in the diagnostic analytics. Then the next steps can be planned in order to be able to successfully shape the path towards prescriptive analytics.
RISC Software GmbH supports you at every stage of the process to generate the greatest possible value from your data.
Contact
Author

DI Dr. Michael Bögl
Mathematical Optimization Specialist

