Explainable Artificial Intelligence (XAI): How Machine Learning Predictions Become Interpretable
von Anna-Sophie Jaeger, MSc
Anna-Sophie Jaeger, MSc schrieb ihre Master Thesis im Bereich “Explaining Text Classification for ICD-Coding”.
Sie unterstützt uns bei der Wahl unserer Kleidung, erleichtert uns die Kommunikation über Sprachbarrieren hinweg, assistiert uns beim Fahren und vereinfacht die Navigation. All diese Bereiche durchdringt Künstliche Intelligenz (KI) und ist damit aus unserem Alltag nicht mehr wegzudenken. Künstliche Intelligenz ist großteils auf tiefe, künstliche neuronale Netzwerke zurückzuführen, die dem menschlichen Gehirn nachempfunden sind. Welche Faktoren für die Vorhersagen entscheidend sind, bleibt dabei meist im Dunkeln. Modelle aus dem Bereich Deep-Learning sind aufgrund ihrer Architektur zwar oft einsehbar, aber nicht interpretierbar (sog. Black Boxes). Das bedeutet, dass Modellvorhersagen und daraus abgeleitete Entscheidungen von Menschen ohne zusätzliche Software nicht nachvollzogen werden können. In bestimmten Situationen ist es jedoch notwendig, die Entscheidungsgrundlage der Vorhersage erklären zu können.
Wird beispielsweise über ein Machine-Learning- (ML-) Modell die Bewilligung eines Kredits entschieden, sind die Beweggründe, die für bzw. gegen die Bewilligung sprechen, durchaus wichtig. Ein weiterer Bereich, in dem die Transparenz von KI-Systemen gefordert wird, ist die Medizin. Fachexpert*innen sollten sich keinesfalls blind auf die Vorhersagen eines ML-Modells verlassen, denn diese sind nicht immer korrekt. Das Vertrauen in das Modell kann jedoch gestärkt werden, wenn die Faktoren, die für die Entscheidung des Modells signifikant waren, offengelegt werden können und damit Nachvollziehbarkeit bzw. Transparenz gegeben ist (siehe auch Fachbeitrag “Vertrauen in die Künstliche Intelligenz”). Welche technischen Methoden zur besseren Interpretation der Modellentscheidungen zum Einsatz kommen können, wird in diesem Fachartikel am Beispiel eines Textklassifikators im medizinischen Bereich gezeigt.
Inhalt
Use-Case: KI als Unterstützung bei der Diagnosefindung
Wie sieht die Erklärung einer Vorhersage aus?
LIME
SHAP
Welche Erklärungsmethode ist besser?
Fazit
Referenzen
Kontakt
Use-Case: KI als Unterstützung bei der Diagnosefindung
Im medizinischen Bereich ist die Diagnose einer Krankheit ein wichtiger Teil des täglichen Arbeitsablaufs. Die “International Statistical Classification of Diseases and Related Health Problems” (ICD) wird weltweit verwendet, um Diagnosen eindeutig zu kategorisieren. ICD-Codes sind hierarchisch organisiert und werden in 19 Krankheitskapitel eingeteilt. Jedes Kapitel besteht aus mehreren Kategorien, welche sich wiederum in Subkategorien unterteilen. Wird ein Bericht über eine Diagnose erstellt, muss diesem ein ICD-Code zugeordnet werden. Die Zuordnung der ICD-Codes erfordert aufgrund der Komplexität und Vielfältigkeit umfangreiches Domänen-Wissen und wird daher von Personen mit medizinischer Expertise vorgenommen. Dieser Prozess ist zeitaufwändig und teuer, kann aber mithilfe von Techniken des maschinellen Lernens effizienter gestaltet werden. Dazu wird ein Modell speziell darauf trainiert, einen ICD-Code basierend auf einer textuellen Beschreibung (z.B. Anamnese oder Entlassungsbericht) vorherzusagen. In einem weiteren Schritt sollen die treibenden Faktoren für die Modellentscheidung identifiziert werden, bspw. indem die aussagekräftigsten Teile des Textes markiert werden. Um eine solche Erklärung zu generieren, gibt es verschiedene Möglichkeiten. Nicht immer ist klar, welche Technik am besten für den konkreten Anwendungsfall geeignet ist. Auch das verwendete Modell spielt hier eine entscheidende Rolle. Erklärmethoden lassen sich dazu in zwei Kategorien einteilen: modell-agnostische Erklärmethoden können die Vorhersage eines beliebigen Modells erklären, modell-spezifische sind auf die Erklärung der Vorhersage von bestimmten Modellen spezialisiert.
Wie sieht die Erklärung einer Vorhersage aus?
Eine Erklärung kann unterschiedliche Formen annehmen und ist abhängig von den verwendeten Daten. Soll beispielsweise die Vorhersage zu einem Bild erklärt werden, werden die relevanten Bildbereiche markiert. Bei tabellarischen Daten wird die Stärke des Beitrags durch die Wichtigkeit der Spalten (sog. “Features”) bewertet. Im konkreten Anwendungsfall zur Interpretation der Diagnosevorhersagen basierend auf Textdaten liegt die Erklärung in der Gewichtung einzelner Textteile oder Wörter – je ausschlaggebender ein Wort für die Vorhersage des Modells war, desto höher ist das Gewicht.
Zwei der am häufigsten eingesetzten modell-agnostischen Erklärmethoden sind LIME und SHAP. Die Vorgehensweise, wie die Gewichtung der Eingabedaten erfolgt, ist bei LIME und SHAP unterschiedlich und wird im nachfolgenden exemplarisch vorgestellt.
LIME
LIME steht für Local Interpretable Model-Agnostic Explanations [1]. “Local” bedeutet in diesem Kontext, dass LIME nicht das gesamte Modell erklärt, sondern nur eine Vorhersage des Modells. Die von LIME generierte Erklärung ist damit nicht für jeden beliebigen Eingabewert gültig, sondern muss für jeden Eingabewert explizit erzeugt werden. “Interpretable” bedeutet, dass die von LIME erzeugte Erklärung – im Vergleich zu den internen Zuständen des zugrundeliegenden Modells – besser interpretierbar für den Menschen ist. “Model-Agnostic” bezeichnet eine Erklärmethode, die unabhängig von der Architektur für jedes beliebige Vorhersagemodell eine Erklärung generieren kann. “Explanations” steht für die von LIME gelieferte Erklärung.
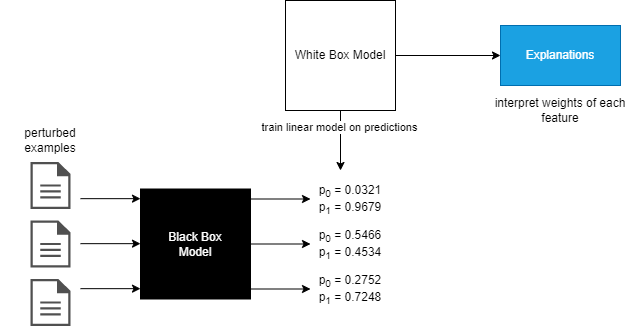
LIME erstellt auf Basis der gegebenen Eingabedaten neue, leicht veränderte Instanzen der Eingabedaten. Die ursprünglichen Eingabedaten werden dabei pertubiert (d.h. modifiziert, indem gewisse Wörter bzw. Wortteile zufällig oder nach einem vorgegebenen Schema entfernt werden). Ist der Eingabetext beispielsweise “the patient suffers from severe headaches”, wäre ein pertubiertes Sample “the patient suffers from headaches” oder “patient suffers headaches”. Diese pertubierten Eingabedaten werden dann verwendet, um ein einfacheres Modell zu erstellen, welches als sog. White-Box-Modell dient und die Vorhersage des Black-Box-Modells erklären kann. In Abbildung 1 wird die Funktionsweise von LIME vereinfacht dargestellt.
Abbildung 1: Für jeden pertubierten Eingabewert wird mittels des zu interpretierenden ML-Modells (Black-Box-Modell) eine Vorhersage erstellt. Das ML-Modell berechnet dabei für ein Beispiel einen Wahrscheinlichkeitswert pro Klasse (p0 und p1). Diese Wahrscheinlichkeitswerte verwendet LIME, um das White-Box-Modell zu erstellen. Ziel ist, dass das White Box Modell möglichst gut die Wahrscheinlichkeitswerte der pertubierten Eingabewerte “erlernt”. Das White-Box-Modell enthält vereinfacht gesagt für jeden möglichen Eingabewert ein Gewicht. Diese Gewichte und die dazugehörigen Eingabewerte bilden die Erklärung.
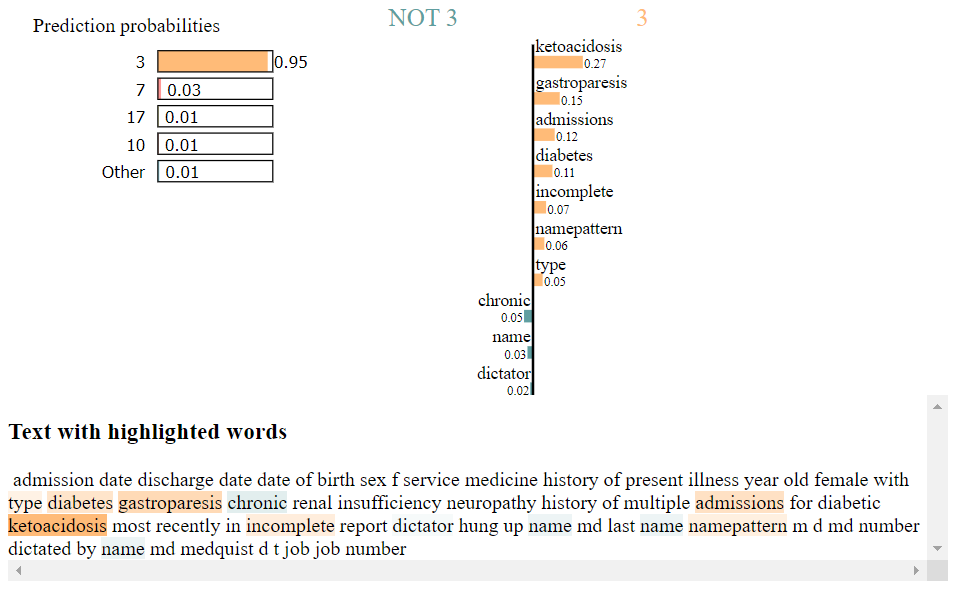
Abbildung 2: Visualisierungsbeispiel der Erklärung von LIME zu einem medizinischen Diagnosetext.
Auf der linken Seite des Diagramms in Abbildung 2 sind die Vorhersagewahrscheinlichkeiten (prediction probabilities) des Black-Box-Modells für die Kapitel mit den höchsten Werten dargestellt. Das wahrscheinlichste Kapitel ist Kapitel 3, “Endokrine, Ernährungs- und Stoffwechselkrankheiten und Störungen des Immunsystems” mit einem Wert von 0,95.
Auf der rechten Seite der Klassenwahrscheinlichkeiten befindet sich eine Legende für die hervorgehobenen Wörter im Text im unteren Bereich der Darstellung, welche durch das White-Box-Modell identifiziert wurden. Ein orange (blau) hervorgehobenes Wort symbolisiert, dass dieses Wort die Klassifizierung als Kapitel 3 erhöht (verringert). Je dunkler das Wort hervorgehoben ist, desto mehr spricht es für bzw. gegen die Einstufung als Kapitel 3. Das Wort mit dem höchsten positiven Beitrag ist in diesem Beispiel “Ketoazidose”, eine schwere Stoffwechselentgleisung mit Insulinmangel, die stark ausschlaggebend für die Kategorisierung als Kapitel 3 ist.
SHAP
SHAP verwendet einen anderen Ansatz, um eine Vorhersage zu erklären. Die Basis hierfür bilden die sog. Shapleywerte von Lloyd S. Shapley [2] aus der Spieltheorie. Ziel ist es, Spieler*innen in einem Spiel einen Anteil zuordnen zu können, gemessen an dem Beitrag des*der jeweiligen Spieler*in zum Spiel. Es ist beispielsweise möglich, dass zwei Spieler*innen A und B gemeinsam einen sehr guten Profit erreichen können. Spielen jedoch Spieler*in A und C zusammen, ist der Profit geringer. Um den individuellen Beitrag der Spieler*innen berechnen zu können, wird jede mögliche Kombination getestet. Diese Vorgehensweise kann auch für die Vorhersage eines ML-Modells verwendet werden. Ein*e Spieler*in ist ein Teil der Eingabewerte, der generierte Profit ist die Veränderung der Vorhersagewahrscheinlichkeit. Die Berechnung für jede mögliche Kombination an Teilen der Eingabewerte ist innerhalb einer angemessenen Laufzeit jedoch nicht möglich. Wie diese Problematik gelöst wurde, kann im originalen Paper „A Unified Approach to Interpreting Model Predictions“ von Lundberg und Lee [3] nachgelesen werden.
Die folgenden zwei Diagramme repräsentieren die Vorhersage von SHAP für das bereits im Abschnitt LIME vorgestellte Textbeispiel.
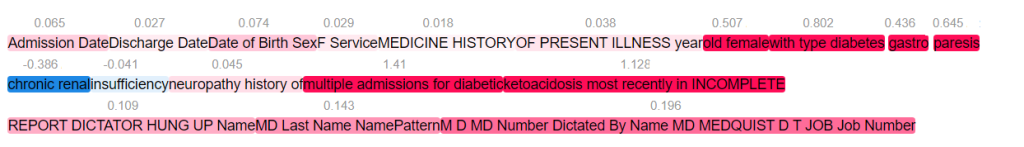
Abbildung 3: Darstellung positiver (rot) und negativer (blau) Shapleywerte
Für die Erklärung, die SHAP generiert, wird der Eingabetext in Textteile unterteilt. Abbildung 3 zeigt einen Zahlenstrahl, auf dem die Textteile des Eingabetextes angeordnet sind. Für jeden Textteil wird ein Shapleywert berechnet. Gestartet wird mit dem “Basiswert” (base value). Der “Basiswert” ist der Shapleywert, wenn kein Input vorhanden ist. Die roten Abschnitte des Zahlenstrahls markieren Textteile mit einem positiven Shapleywert. Ein positiver Shapleywert erhöht die Vorhersagewahrscheinlichkeit für die jeweilige Klasse. Auf der rechten Seite des Zahlenstrahls befinden sich blau markierte Textteile. Diese Textteile haben einen negativen Shapleywert und verringern die Wahrscheinlichkeit der Vorhersage der gegebenen Klasse.
Abbildung 4: Detailliertere Darstellung der Shapleywerte nach Einflussstärke
In Abbildung 4 wird der Eingabetext angezeigt. Der Eingabetext ist in dieselben Textteile unterteilt wie in Abbildung 3, zeigt über die Intensität der Farbe jedoch zusätzlich die Stärke des Einflusses. Textteile mit den höchsten bzw. niedrigsten Shapleywerte werden in einer dunkleren Farbe hervorgehoben. Jener Textteil mit dem höchsten Shapleywert ist “ketoacidosis most recently in INCOMPLETE”.
Welche Erklärmethode ist besser?
Eine Bewertung, welche Erklärmethode “besser” ist, kann immer nur im Kontext eines spezifischen Anwendungsfalls evaluiert werden. Erklärmethoden können miteinander verglichen werden, indem Personen mit Expertise für die jeweilige Domäne zurate gezogen werden, welche die generierten Erklärungen bewerten. Es gibt allerdings auch Ansätze, um Erklärmethoden miteinander vergleichen zu können, ohne Fachpersonal zu benötigen [4], da dieses nicht immer zur Verfügung steht. Dazu werden unterschiedliche Eigenschaften bewertet, u. a. folgende:
Die Effizienz einer Erklärmethode kann bewertet werden, indem die benötigte Zeit, um eine Erklärung zu generieren, gemessen wird.
Darüber hinaus sollen die generierten Erklärungen stabil sein. Stabilität bedeutet in diesem Kontext, dass, wenn die Erklärmethode mehrere Erklärungen mit demselben Eingabewert generiert, diese Erklärungen möglichst ähnlich sein sollten.
Am spannendsten ist wohl die Frage, ob die generierte Erklärung aussagekräftig ist. Mit anderen Worten, wie effektiv ist die Erklärung der Erklärmethode?
Unsere Erfahrung am Anwendungsfall des ICD-Klassifikators hat gezeigt, dass im Vergleich auf Effizienz, Stabilität und Effektivität SHAP verglichen mit LIME effizienter, stabiler und effektiver ist. LIME ist gut geeignet, um das “wichtigste” Wort in einem Text zu finden. Nachteilig ist, dass die von LIME generierte Erklärung durch die Pertubation des Inputtextes stark variiert und damit nicht immer verlässlich ist. Zusätzlich ist die Laufzeit von SHAP im Vergleich zu LIME geringer.
Fazit
Eine Erklärung für die Vorgänge in ML-Modellen kann in bestimmten Bereichen nützlich, in anderen notwendig sein. LIME und SHAP bieten die Möglichkeit, einen Einblick in die Funktionsweise von ML-Modellen zu erhalten. Obwohl auch die Erklärmethoden nicht immer vollständig und genau sind, können sie Endanwender*innen in vielen Fällen durch einfache Hervorhebungen in Texten oder Bildern bei der Überprüfung der ML-Vorhersagen unterstützen.