Abra CaTabRa: Analyze and validate data automatically and use it to train machine learning models
by Sophie Kaltenleithner, MSc
Data is now collected in almost all areas of life – be it the products purchased when shopping online, exercise and nutrition information in fitness apps or machine data in the production process. The frequent aim of this is to make automatic predictions: Which target groups should my product be suggested to? What weight loss can I expect if I run one lap a day? When do I need to replace the wearing parts on my machines to minimize downtimes?
Complex analysis activities and technical expertise are required to make such predictions possible. This effort cannot always be invested in projects. CaTabRa provides a remedy here: CaTabRa is an open source tool for automating steps in the analysis of tabular data and the development of prediction models. It is suitable both for domain experts without technical know-how and for data scientists who want to efficiently extract information from their data. Statistical evaluations, training of machine learning models, explanation of model decisions, validation of input data. All this is done with little effort!
Contents
Application example from medicine: Covid-19 detection in blood tests
Data analysis and training
Model explanation – Explainable AI
Detection of invalid input – Out-of-Distribution Detection
Conclusion – caution is advised when predicting Covid-19
Advantages of using CaTabRa
Sources
Author
Application example from medicine: Covid-19 detection in blood tests
Can COVID-19 be diagnosed based on the results of a standard blood test? Researchers from JKU, KUK MedCampus III and RISC Software GmbH investigated this topic in 2022 [1] . The aim was to detect Covid-19 infections from routine laboratory tests in order to be able to test a large number of patients quickly and without additional effort. How similar results can be generated using CaTabRa alone is demonstrated below.
CaTabRa works on tabular data. Rows are individual samples and columns are their characteristics (features). In our example, the samples are patients and the features are their blood values. The target value must also be defined. This can be a numerical value (regression) or – as here – a categorical value (classification): “infected” and “not infected”.
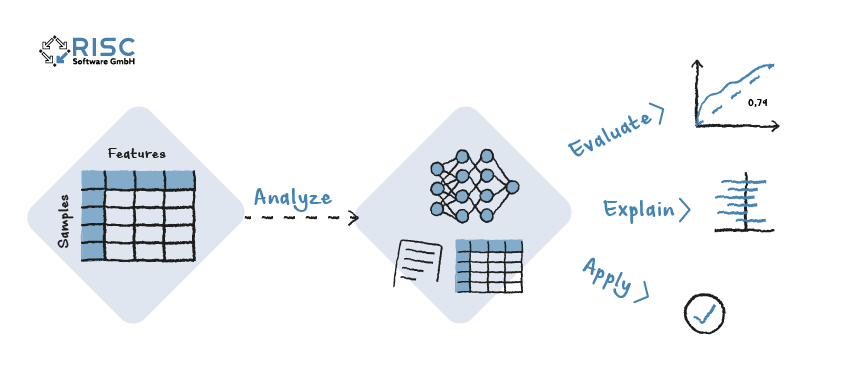
A typical workflow consists of applying the following four steps, which can be called up via command line commands:
1. Analyze
Erstellt Statistiken und trainiert Vorhersagemodelle.
2. Evaluate
Evaluiert die Modelle auf einem Testdatensatz, um ihre Qualität zu überprüfen.
3. Explain
Generiert Erklärungen für Modellentscheidungen in Form von Feature-Importance Scores.
4. Apply
Trifft Vorhersagen für neue Samples durch Anwenden der zuvor trainierten Modelle.
Figure 1: The typical workflow when using CaTabRa consists of the four steps Analyze, Evaluate, Explain and Apply.
Data analysis and training
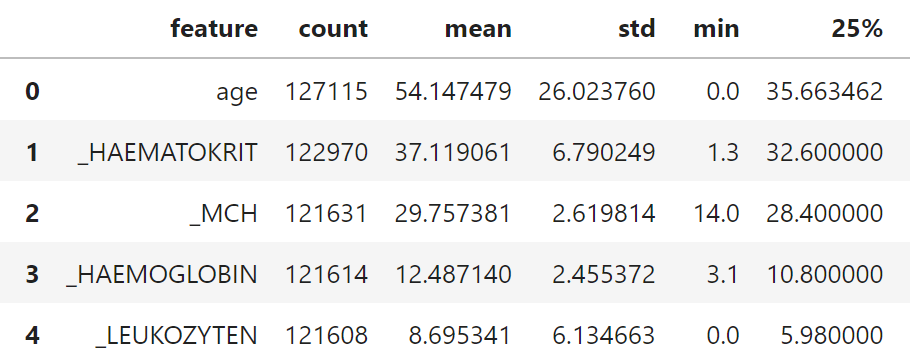
In the first step, Analyze generates descriptive statistics to provide a better overview of the data. These are calculated for each feature. Depending on the data type, these include the number of entries in the data set, extreme values, mean values, correlations with other columns, etc. The tables in the figure below show this as an example for selected features of the Covid-19 data.
Figure 2: Exemplary excerpt from the Covid-19 data.
In the second step, a model is trained that predicts the defined target value – in this case, whether a Covid-19 infection is present. The quality of machine learning models depends heavily on the algorithms used and their configurations. These cannot be easily determined in advance. CaTabRa therefore relies on state-of-the-art AutoML methods to find the right configuration quickly and without much manual effort. AutoML stands for “Automated Machine Learning”. Complicated optimization methods are used to gradually approach the best solution – without any manual effort.
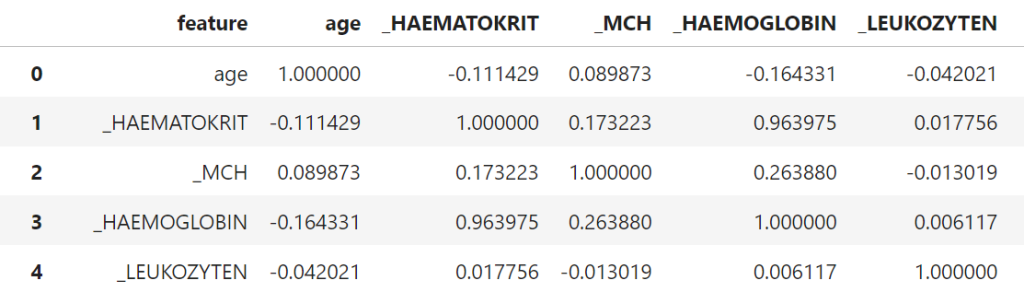
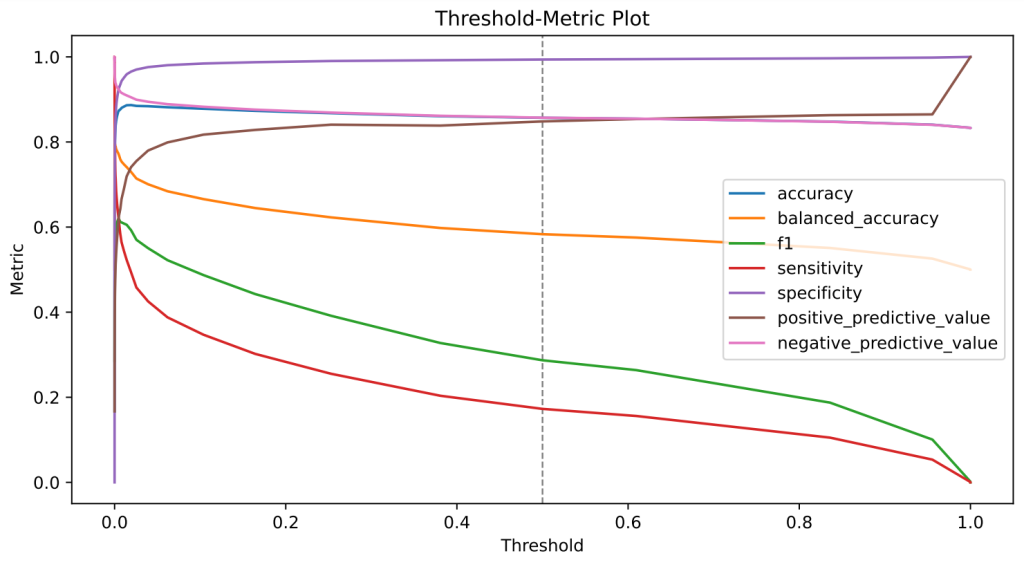
Once the training has been completed, the quality of the model can be checked using the Evaluate functionality. Detailed performance reports and corresponding visualizations are created. The evaluation is carried out using a part of the Covid-19 data set that was not used for training. This makes it possible to estimate how well the model can handle new data. The figure below shows examples of the resulting graphs. These visualize certain quality metrics as a function of the model predictions. The obtained ROC-AUC value – a quality measure for classification problems – is comparably good as the one in the original publication.
Figure 3: Example graphics for model evaluation generated by CaTabRa. Left: ROC curve; Right: Metric values as a function of the decision threshold.
Model explanation – Explainable AI
Decisions made by black-box machine learning models are difficult for humans to understand. In medicine in particular, however, it is important not to blindly trust the models. There is often an unintentional bias in the data, for example, which causes the models to draw the wrong conclusions. If, for example, more men than women had been diagnosed with Covid-19 by chance in the training data, it could be that the gender of the patients was too strongly factored into the decision.
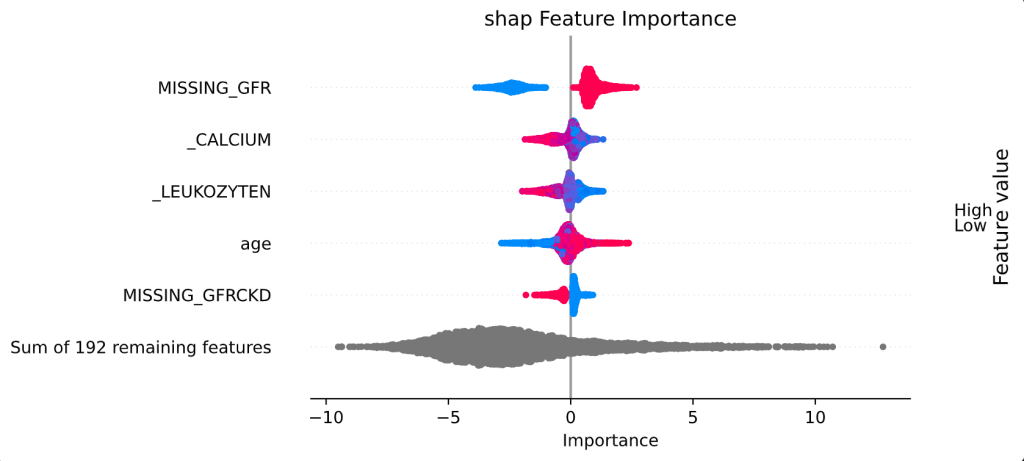
The figure below shows the feature importance scores of the Covid data for the five most important features. A point corresponds to a sample, with the color representing the feature value (blue: low, red: high). The position on the x-axis shows how a feature influences the result for a particular sample. For example, the absence of glomerular filtration rate measurements (“MISSING_GFR”; a parameter that primarily measures kidney function) tends to indicate a Covid infection, and old age also appears to be an indicator for the data set used. Overall, however, the prediction model pays attention to many different features instead of basing the decision on a few features.
Figure 4: Feature importance plot for the Covid data based on SHAP values.
Detection of invalid input – Out-of-Distribution Detection
Machine learning models generally assume that new data to be predicted corresponds to the distribution of the original training data. In reality, however, so-called “domain shifts” often occur, i.e. a change in the data distribution. There can be many reasons for this: The training data set was not representative enough, measurement methods have changed, characteristics change over time, etc. In any case, the model decisions are no longer reliable in such cases. CaTabRa therefore trains out-of-distribution (OOD) detectors to check how much a certain input differs from the training data. They are automatically applied when Apply (i.e. the prediction functionality) is called. This way, users know when they should question model predictions.
With the Covid-19 data, it was found that models that were only trained on data at the beginning of the pandemic made worse predictions at later points in time. This could be due to the fact that the virus has generally spread more in society, but also because new mutations have occurred. If only data from the first ten months of the pandemic are used for model training and the generated OOD detectors are subsequently applied to data that also includes months eleven and twelve, changed distributions can be detected for 81 of a total of 95 continuous features.
Conclusion – caution is advised when predicting Covid-19
This can be seen from the results of the original publication and is also evident when using CaTabRa: Blood tests are a relatively good indicator of whether a person has contracted Covid-19. However, this is only true as long as you can be sure that the characteristics of the virus and its spread will not change too much. However, as most people will have noticed, this is not the case in reality. A rapid spread of the virus, lockdowns and mutations could all lead to a change in distribution. It is therefore advisable to continuously check the quality of machine learning models on current data and to retrain them if necessary.
Advantages of using CaTabRa
It makes the evaluation of data simpler and more efficient – you can quickly and easily gain an insight into the data to determine, for example, whether the use of machine learning methods makes sense.
It creates appealing visualizations that can be used directly in publications.
In contrast to similar cloud solutions, no sensitive data needs to be uploaded – everything happens locally.
The focus is on flexibility: CaTabRa can be easily expanded so that the process can be adapted using your own methods. In addition, a variety of configurations are offered out-of-the-box.
CaTabRa is also a Python library that provides the individual features and methods for data preparation via programming interfaces.
[1] T. Roland et al, ‘Domain Shifts in Machine Learning Based Covid-19 Diagnosis From Blood Tests’, J Med Syst, vol. 46, no. 5, p. 23, Mar. 2022, doi: 10.1007/s10916-022-01807-1.