From manual inspection to intelligent monitoring: AI-based innovations in flame cutting
by Dominik Falkner, MSc
RISC Software GmbH developed a solution for framag Industrieanlagenbau GmbH to optimize wear in the flame cutting process with the help of machine learning. This can reduce downtimes and improve product quality.
The importance of nozzles in the flame cutting process
From raw signal to analysis: Efficient data processing and labeling of structure-borne sound data
Proof of concept for structure-borne sound analysis: findings and initial results
A foundation for the future: challenges and potential of data-based nozzle monitoring
References
Author
The importance of nozzles in the flame cutting process
The flame cutting process is a thermal separation process in which metals are cut efficiently by precisely controlling the oxygen jet and evenly mixing the fuel gas. The condition of the nozzle plays a decisive role here: the cutting process can cause deposits to form in the nozzle, which impair the quality of the cutting flame and therefore make it more difficult to separate the material cleanly. Until now, nozzles suspected of being worn were sent back to framag, where specialists checked the condition as part of a manual test procedure (a test was used to visually and audibly inspect the flame) and repaired or replaced the nozzle if necessary (see Figure 1). The aim of this project is to optimize this laborious process through the use of machine learning. By analyzing structure-borne sound data, the condition of the nozzles is to be reliably recorded so that a clear distinction can be made between new and worn nozzles. This is a first step towards automated monitoring of nozzles in the production hall.
Figure 1: Shows the previous process for monitoring the nozzles.
From raw signal to analysis: Efficient data processing and labeling of structure-borne sound data
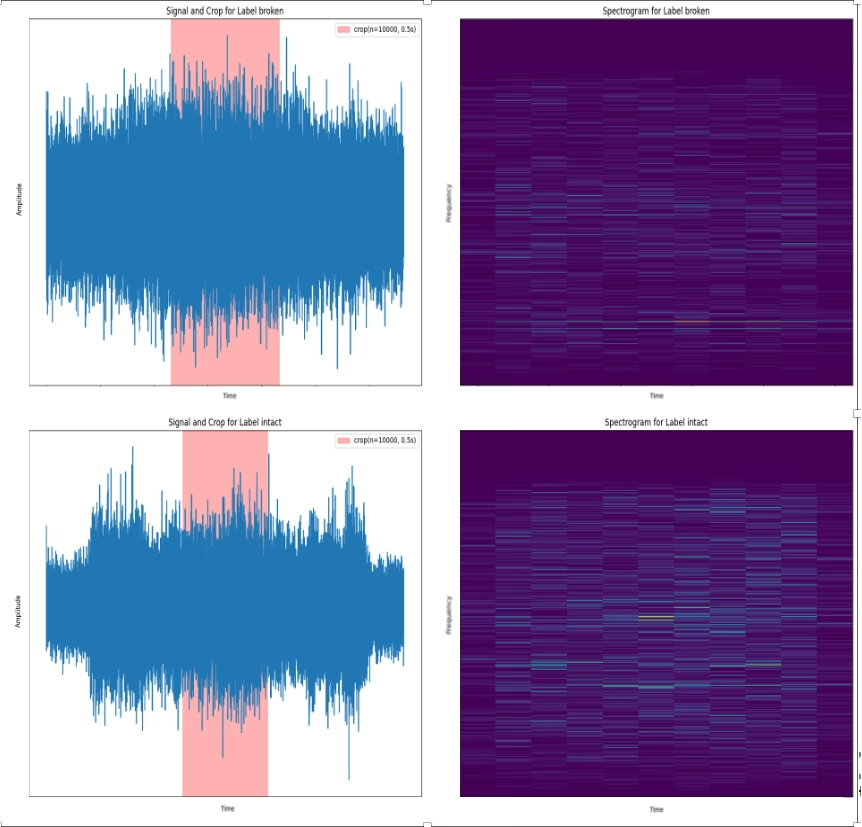
The spectral analysis of the structure-borne sound data made it possible to identify specific patterns that indicate wear characteristics of the nozzles and thus allow a distinction to be made between new and worn nozzles. In order to calculate these patterns, a key challenge was to efficiently process the raw data from the structure-borne sound sensor. This raw data first had to be converted into an industrially standardized format so that it could be used consistently and quickly for further analysis steps. The structured sensor data then served as indicators to detect wear conditions.
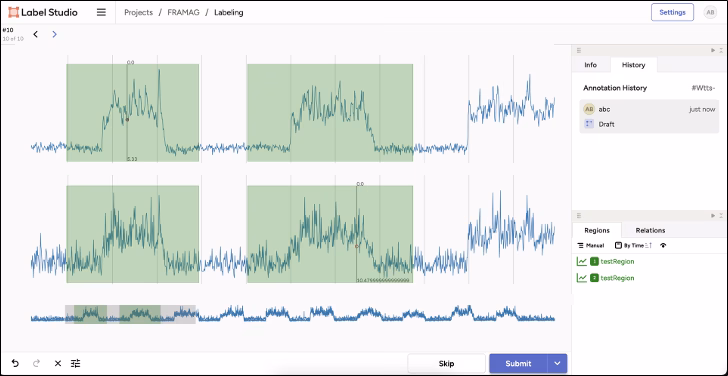
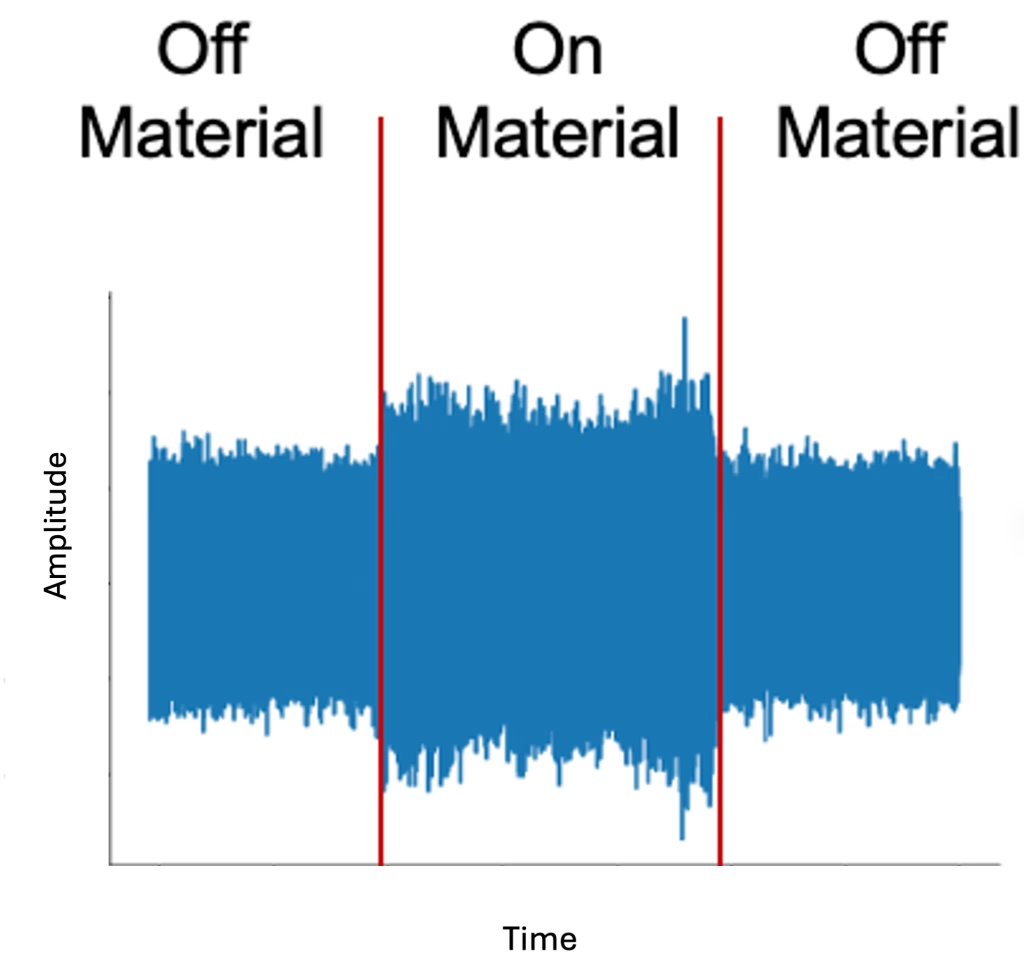
In order to realize the proof-of-concept, the sensor data had to be labeled manually, as previous wear tests of the nozzles were traditionally carried out by specialists. The manual testing process, as shown in Figure 2b, consists of three phases: a flame analysis without material contact, then with material contact and finally again without material contact. This test sequence represents typical operating conditions in the production hall. In order to make labeling efficient, we provide an annotation service^{1} so that experts can mark the relevant data areas in a targeted manner and save them in a structured manner. The result was marked data sections prepared for analysis, as shown in Figure 2b. These sections created in this way form the basis for the computational study.
Figure 2b: Shows the UI of the labeling tool. Here, experts can quickly mark and check relevant areas in the multidimensional sensor data.
Figure 2a: Shows the raw sensor data of a ‘test’. The 3 areas are representative of the condition of the nozzle. The lower image shows the spectrum of two tests. Differences in different frequency ranges can already be seen here.
Proof of concept for structure-borne sound analysis: findings and initial results
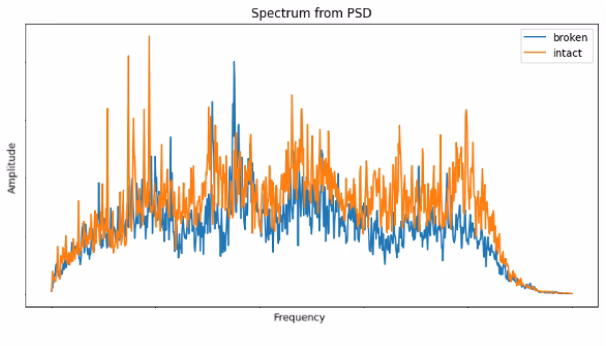
For the analysis, the structure-borne sound data was converted into frequency space using the Fast Fourier Transformation^2. Figure 3 shows an example of the spectra from two tests and illustrates the differences in the frequency patterns between new and worn nozzles.
Figure 3: Power Spectral Density of two tests (top worn, bottom intact)
The data set was divided into training and test data, whereby strict care was taken to ensure that tests of the same nozzles were either fully included in the training or test set. This separation ensures a realistic evaluation of the prediction quality. The model evaluation is performed by cross-validation on the test data to ensure a robust assessment of the model performance. For the calculation of the spectra and the derivation of the input features for the classification, an extensive computational study was carried out, which took around 30 hours on 29 computing cores.
The results of the project are extremely promising. Depending on the data set and parameters, excellent results were achieved. Metrics for unbalanced data sets were used to ensure a fair evaluation. The best model, a neural network^3, achieved a weighted F1 score and a balanced accuracy of over 0.95.
A foundation for the future: challenges and potential of data-based nozzle monitoring
Some challenges became apparent during the course of the project: data preparation requires extensive pre-processing and the limited variety of nozzles tested limits the validity of the experiments. In order to further validate and improve the approaches, it is necessary to collect additional data from different types of nozzles as well as from intact nozzles and include them in the analysis.
Despite these hurdles, the proof-of-concept represents an important step towards optimized, data-based monitoring of the flame-cutting process. The knowledge gained by RISC Software GmbH creates a solid foundation for future initiatives in which the models are to be further developed and verified using an expanded database. In the long term, this solution offers the potential to significantly increase the efficiency and precision of flame cutting at framag Industrieanlagenbau GmbH by enabling maintenance to be carried out in a more targeted and proactive manner.