How software helps doctors analyze brain aneurysms
by DI Dr. Wolfgang Fenz
As part of the ARES research project, software was developed that analyzes cerebral aneurysms and assesses the risk of rupture. It combines innovative technologies such as geometry and biomechanics simulations and sets new standards in medical diagnostics.
Cerebral aneurysms – dilations of arteries in the brain – are a serious medical problem. It is particularly difficult to assess whether and when an aneurysm could rupture, which can have life-threatening consequences. The ARES (Aneurysm Risk Estimation Support) research project has developed software to facilitate diagnosis and treatment planning. This innovative solution combines geometric and biomechanical analyses to precisely assess the risk of rupture based on numerous parameters.
Contents
ARES: An interdisciplinary solution for aneurysm analysis
Simulation of blood flow and biomechanical forces
Key figures for risk assessment
Intuitive visualization of the results
Validation and outlook
References
Contact us
Author
Read more
ARES: An interdisciplinary solution for aneurysm analysis
When planning the treatment of brain aneurysms, it is particularly difficult to assess the risk of rupture. In order to provide doctors with a more sound basis for making decisions on the treatment of an aneurysm, software was developed as part of the ARES research project. This provides relevant geometry- and blood flow-based measures as well as corresponding risk intervals, similar to a blood laboratory result. The tool offers a user-friendly workflow that ranges from the import of imaging procedures and model generation to the calculation and visualization of the features. RISC Software GmbH, eulerian-solutions (consortium lead), the JKU Linz (Institute for Polymer Product Engineering – IPPE) and the Neuromed Campus of the KUK are involved in the ARES project.
Figure 1: Similar to a blood lab report, ARES provides relevant geometry- and blood flow-based measures and associated risk intervals. The tool offers an intuitive workflow from the import of images from imaging procedures and model generation to the calculation and visualization of features.
Simulation of blood flow and biomechanical forces
First, the aneurysm including the inflow and outflow vessels is segmented from the patient’s 3D image data (DSA, MR or CT), whereby the volume can be processed at voxel level. The blood lumen’s medial lines are calculated, on which inflow and outflow surfaces can be placed to simulate the blood flow, and the aneurysm sac is separated from the carrier vessel by an interface.
Figure 2: Cropping the relevant region in the 3D image data.
Figure 3: Definition of inflows and outflows along the segmented blood vessel.
Figure 4: Definition of the aneurysm sac (blue) on the final 3D model.
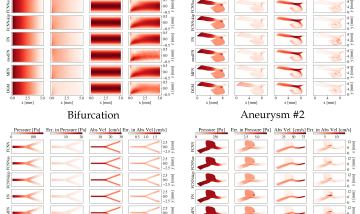
This is followed by an automatic analysis of the aneurysm geometry and a numerical blood flow simulation, taking into account the interaction between the fluid and the structure. In addition, the influence of the forces acting on the elastic vessel wall, the resulting stresses and deflections, and the distribution of pressure and velocity in the blood vessel are calculated. The material models and parameters (modulus of elasticity) used were determined in experiments with samples of real vessel walls [1].
Key figures for risk assessment
In a calculation time of around 10 minutes, over 60 geometric, flow-based and structural-mechanical features can be displayed in tabular form, grouped according to their significance. Depending on their complexity, the morphological parameters are divided into 1D indices (e.g. maximum diameter, height, volume), 2D indices (e.g. the ratio of the aneurysm size to the diameter of the carrier vessel (size ratio) or the aspect ratio), 3D indices (convexity, ellipticity, non-sphericity index (NSI)) and parameters based on the surface curvature. The hemodynamic (flow-based) characteristics include mean and extreme values of blood pressure, wall shear stress (WSS) and oscillatory shear index (OSI). The structural-mechanical (elasticity-based) characteristics include Mises stress and elongation or deflection.
Intuitive visualization of the results
All results are clearly displayed in the program, either through geometric illustrations or through the representation of physical parameters on the blood surface.
Figure 5: Deflection of the aneurysm wall. The arrow marks the position of the maximum, the boxplot shows the comparison with the statistics of all aneurysms examined.
Figure 6: Graphical representation of the geometric height-to-width ratio (HWR).
Figure 7: Visualization of the Gaussian curvature of the aneurysm surface.
Figure 8: Visualization of areas of the vessel wall with particularly high mechanical stress (red).
Validation and outlook
The methods were tested on more than 400 data sets. Risk thresholds and the most relevant measures for different aneurysm locations were determined from the distribution of ruptured and stable aneurysms. In addition to the parameters known from the literature, such as the norm of Gaussian curvature, NSI or size ratio, novel combined indicators that unite geometric and biomechanical parameters, such as the HGD value (a combination of tension, curvature and deflection), showed a high statistical significance [2].
Depending on the value of the current parameters in relation to the corresponding limit values, three risk levels (low, medium, high) are distinguished and displayed graphically (gray, yellow or red bars). Physicians can use the tool we have developed to intuitively calculate complex aneurysm characteristics based on geometry and biomechanics with minimal interaction – a task that was previously only possible with special software and expertise in numerical simulation. The aim is to improve or support the diagnosis of cerebral aneurysms and the assessment of the risk of rupture in clinical practice in the future. A continuation of the project, the inclusion of further key figures and a multi-center study to expand the database are also planned.
Fig. 9: A small section of the aneurysms examined as part of the project (the vessel wall models can be seen) shows the high variability of the geometries that occur.
References
[1] Nagy, J., Maier, J., Miron, V., Fenz, W., Major, Z., Gruber, A., Gmeiner, M., 2023. Methods, Validation and Clinical Implementation of a Simulation Method of Cerebral Aneurysms. Journal of Biomedical Engineering and Biosciences 10, p. 10. https://doi.org/10.11159/jbeb.2023.003
[2] Nagy, J., Fenz, W., Thumfart, S., Maier, J., Major, Z., Stefanits, H., Gollwitzer, M., Oberndorfer, J., Stroh, N., Giretzlehner, M., Sonnberger, M., Gruber, A., Rauch, P.-R., Gmeiner, M., 2025. Fluid structure Interaction analysis for rupture risk assessment in patients with middle cerebral artery aneurysms. Scientific Reports, 15(1), p. 1965. https://doi.org/10.1038/s41598-024-85066-9